HI-SIGMA
Data-driven high-dimensional inference with generative models
Almost every measurement at the LHC boils down to the same statistical exercise: we have a pile of collision events, some tiny fraction of which might come from the rare process we care about (a signal), while the vast majority come from mundane, well-known processes (the background). To measure the signal, we need to know what the background looks like and count how many events sit on top of it.
The hard part is that signal and background often look almost identical, and the only way to tell them apart is to use many features of each event at once — the momenta of the particles, the angles between them, and so on. Modern analyses lean heavily on machine learning to do this. The standard recipe is to train a classifier: a neural network that looks at all these features and outputs a single number, close to 1 for signal-like events and close to 0 for background-like events. You then either cut away the low-scoring events, or fit the distribution of this classifier score to extract your signal.
This works well, but it has some real drawbacks. The classifier score is not very interpretable — it collapses a rich, multi-dimensional space down to one number, so it’s hard to look at the final result and sanity check that the signal and background actually look the way you expect. Additionally, classifiers are almost always trained on simulation, and our simulations of the background are often not perfect. If the simulation is even slightly off, the classifier learns the wrong thing and your analysis loses sensitivity. Estimating how much background survives a classifier cut, accounting for all the correlations between features can also be quite difficult and time consuming. Finally, the collapse of high dimensional information into a single number is fine when testing ‘simple’ one-parameter hypotheses (such as whether this signal exists, yes or no), but for more complex measurements with multiple parameters of interest, or if there are non-linear effects at play such as quantum interference, then collapsing into a single number actually loses a significant amount of information.
In this project, my collaborator Manuel Szewc and I introduced a new method, HI-SIGMA (High-Dimensional Statistical Inference with Generative Models of AI), that tackles all of these problems at once (Amram & Szewc, 2025).
Learning the densities instead of a classification score
The key idea is to stop using a classifier entirely. Instead of training a network to separate signal from background, we train generative machine learning models to learn the full multi-dimensional probability density of the signal and the background — essentially, a model that knows how likely any given event is to have come from each process. Once we have these ML-learned densities, we can plug them directly into the same likelihood-based statistical machinery that particle physicists have used for decades. In a sense HI-SIGMA is just a machine-learning-powered version of the histogram-based template fits the field already knows and trusts, except it works in many dimensions at once instead of just one.
The trick that makes this data-driven is the same one used in anomaly detection searches. We focus on resonance analyses, where the signal produces a bump at a particular value of some mass variable. This lets us define a “signal region” around the bump, with “sideband” regions on either side that are essentially pure background. We train a generative model (a normalizing flow) on the sideband data to learn the background density, and because the model is conditioned on the mass, we can smoothly interpolate it into the signal region. This means our background estimate comes directly from the data, sidestepping the simulation mismodeling challenges entirely. The signal density, which we do trust simulation to describe, is learned from simulated signal events. We combine the machine learned densities of the high dimensional features (\(p(\vec{x}\,|\,m)\)) with standard analytic formulas used to model the mass distributions (\(p(m)\)) to construct our full statistical model. A nice mix of new and classic methods!
A di-Higgs test case
We demonstrated the method on a simplified version of one of the marquee measurements of the high-luminosity LHC: di-Higgs production in the \(bb\gamma\gamma\) final state (two bottom quarks and two photons). Measuring di-Higgs production is a direct probe of how the Higgs boson interacts with itself, and it’s so rare and so swamped by background that it’s essentially impossible without multivariate techniques and data-driven backgrounds — which makes it a perfect showcase for HI-SIGMA. We used the sharp di-photon mass peak as our resonant variable and four additional kinematic features to separate signal from background.
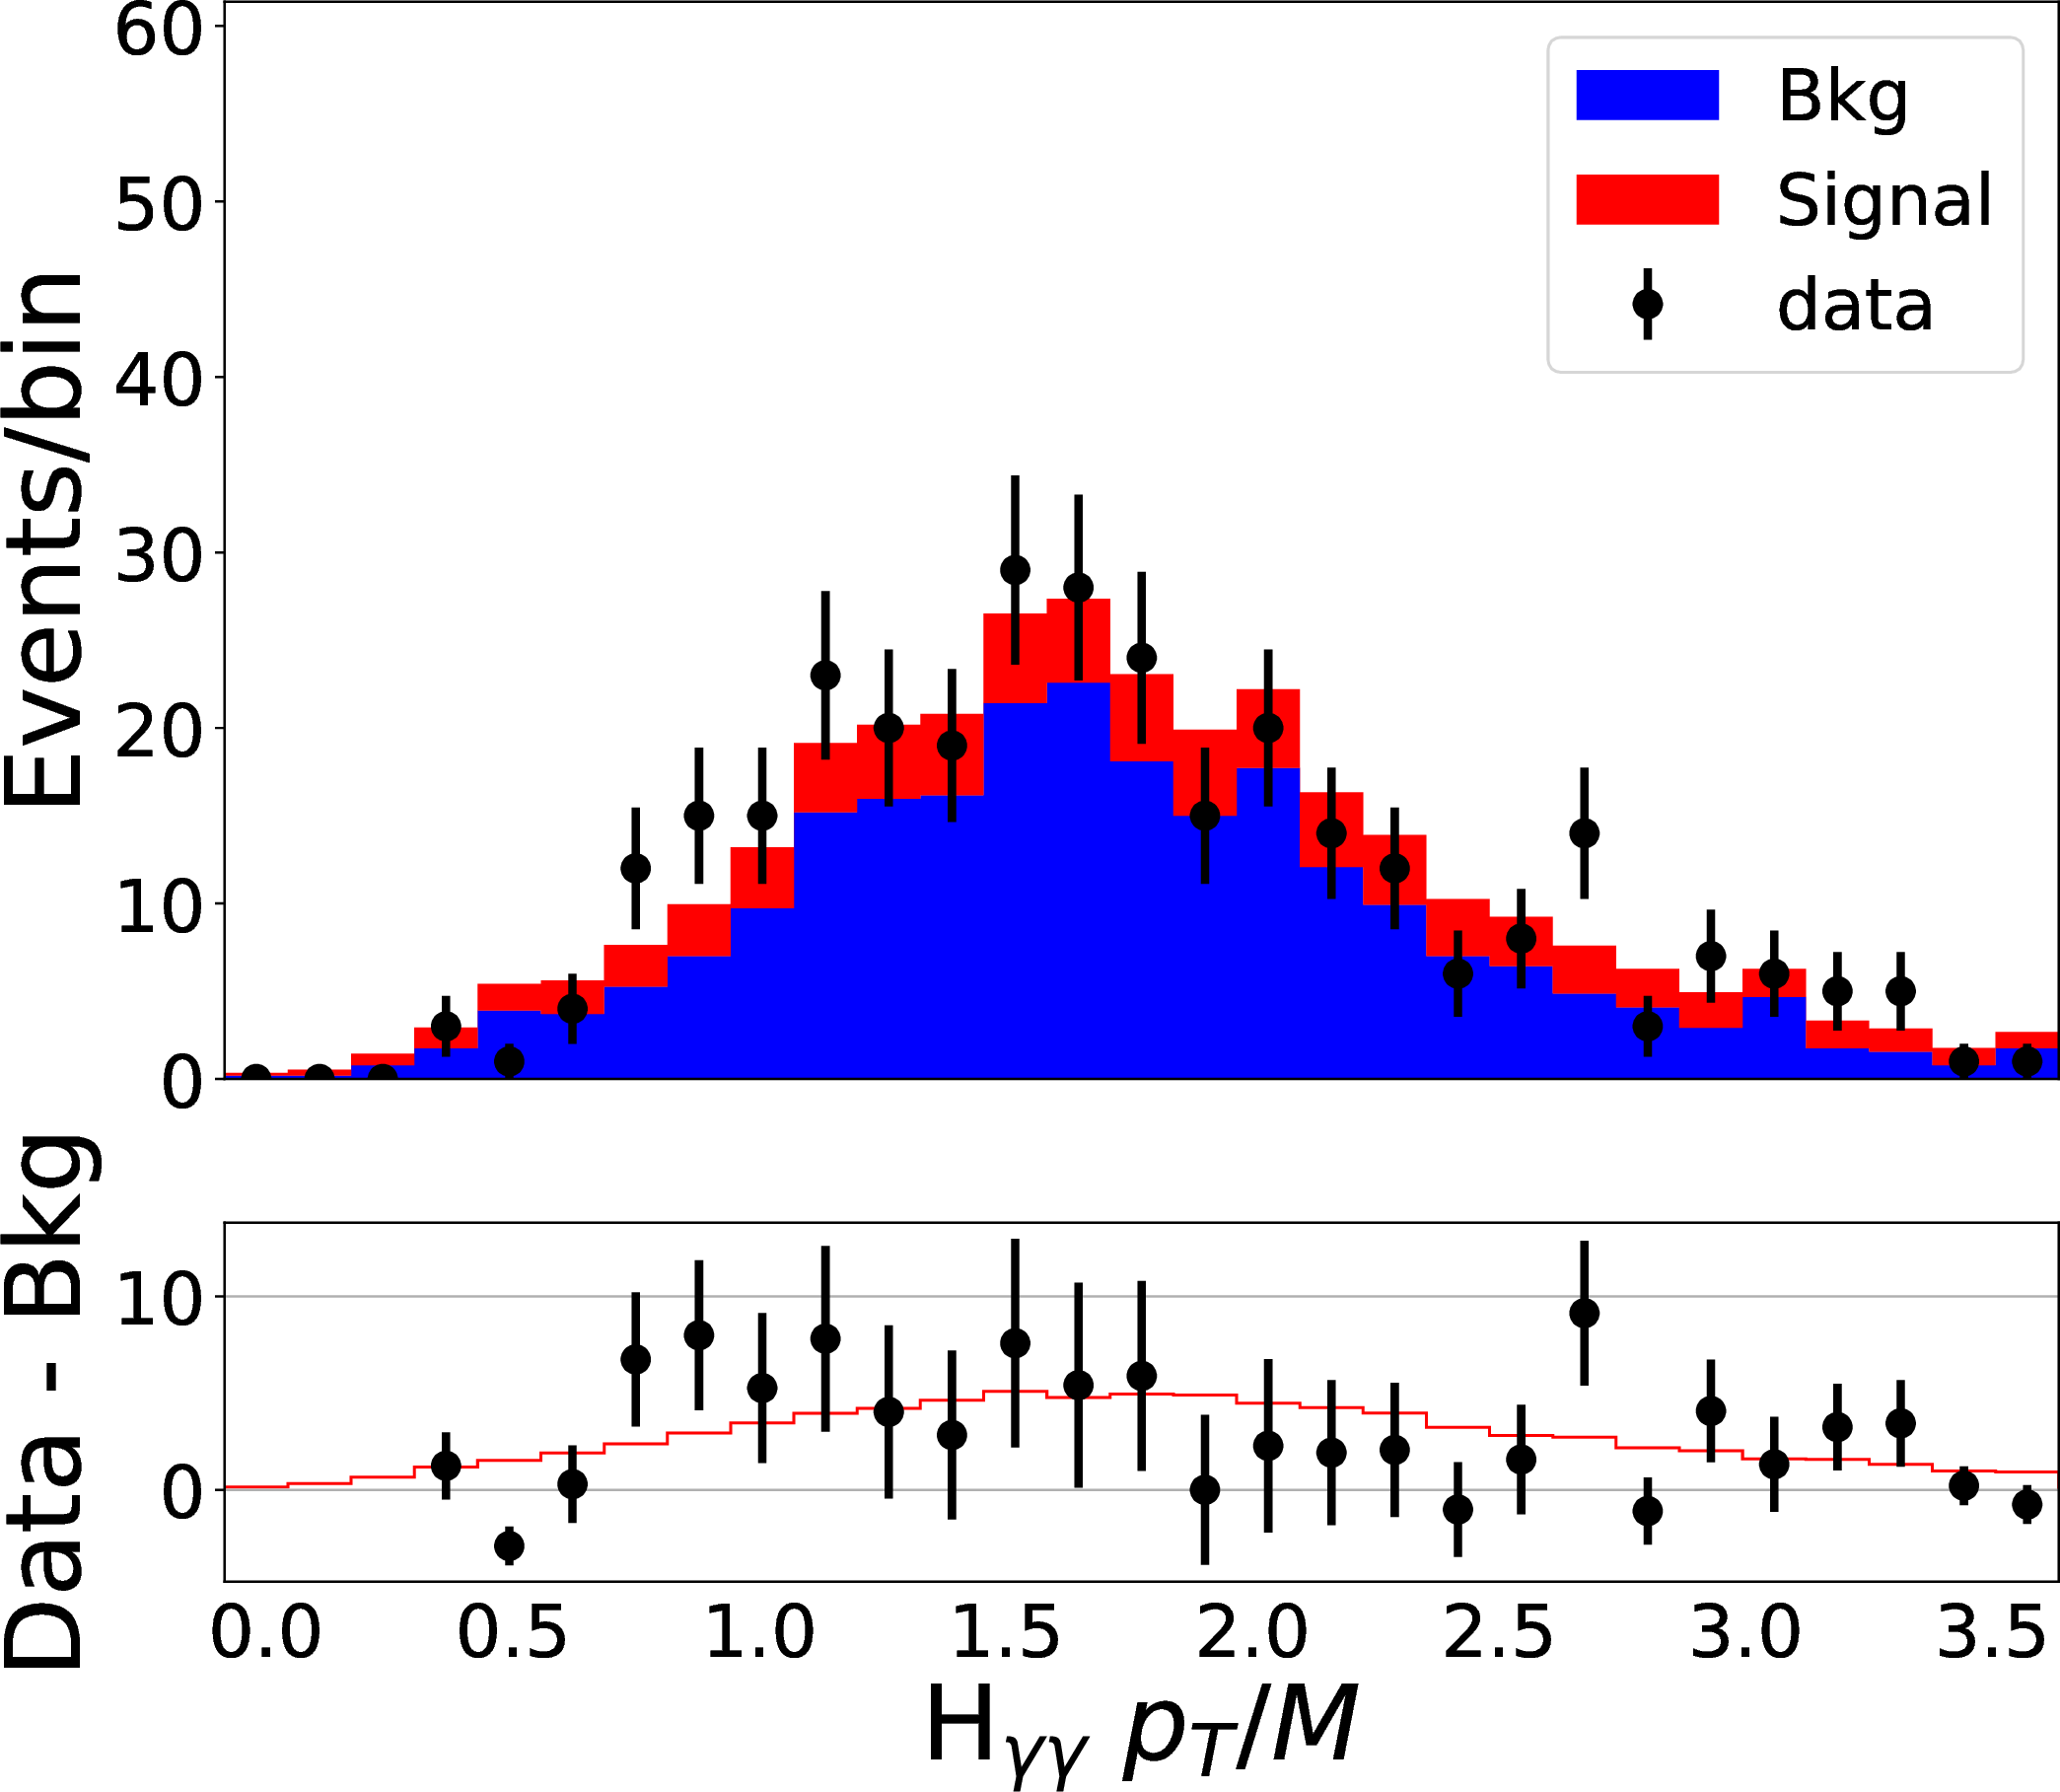
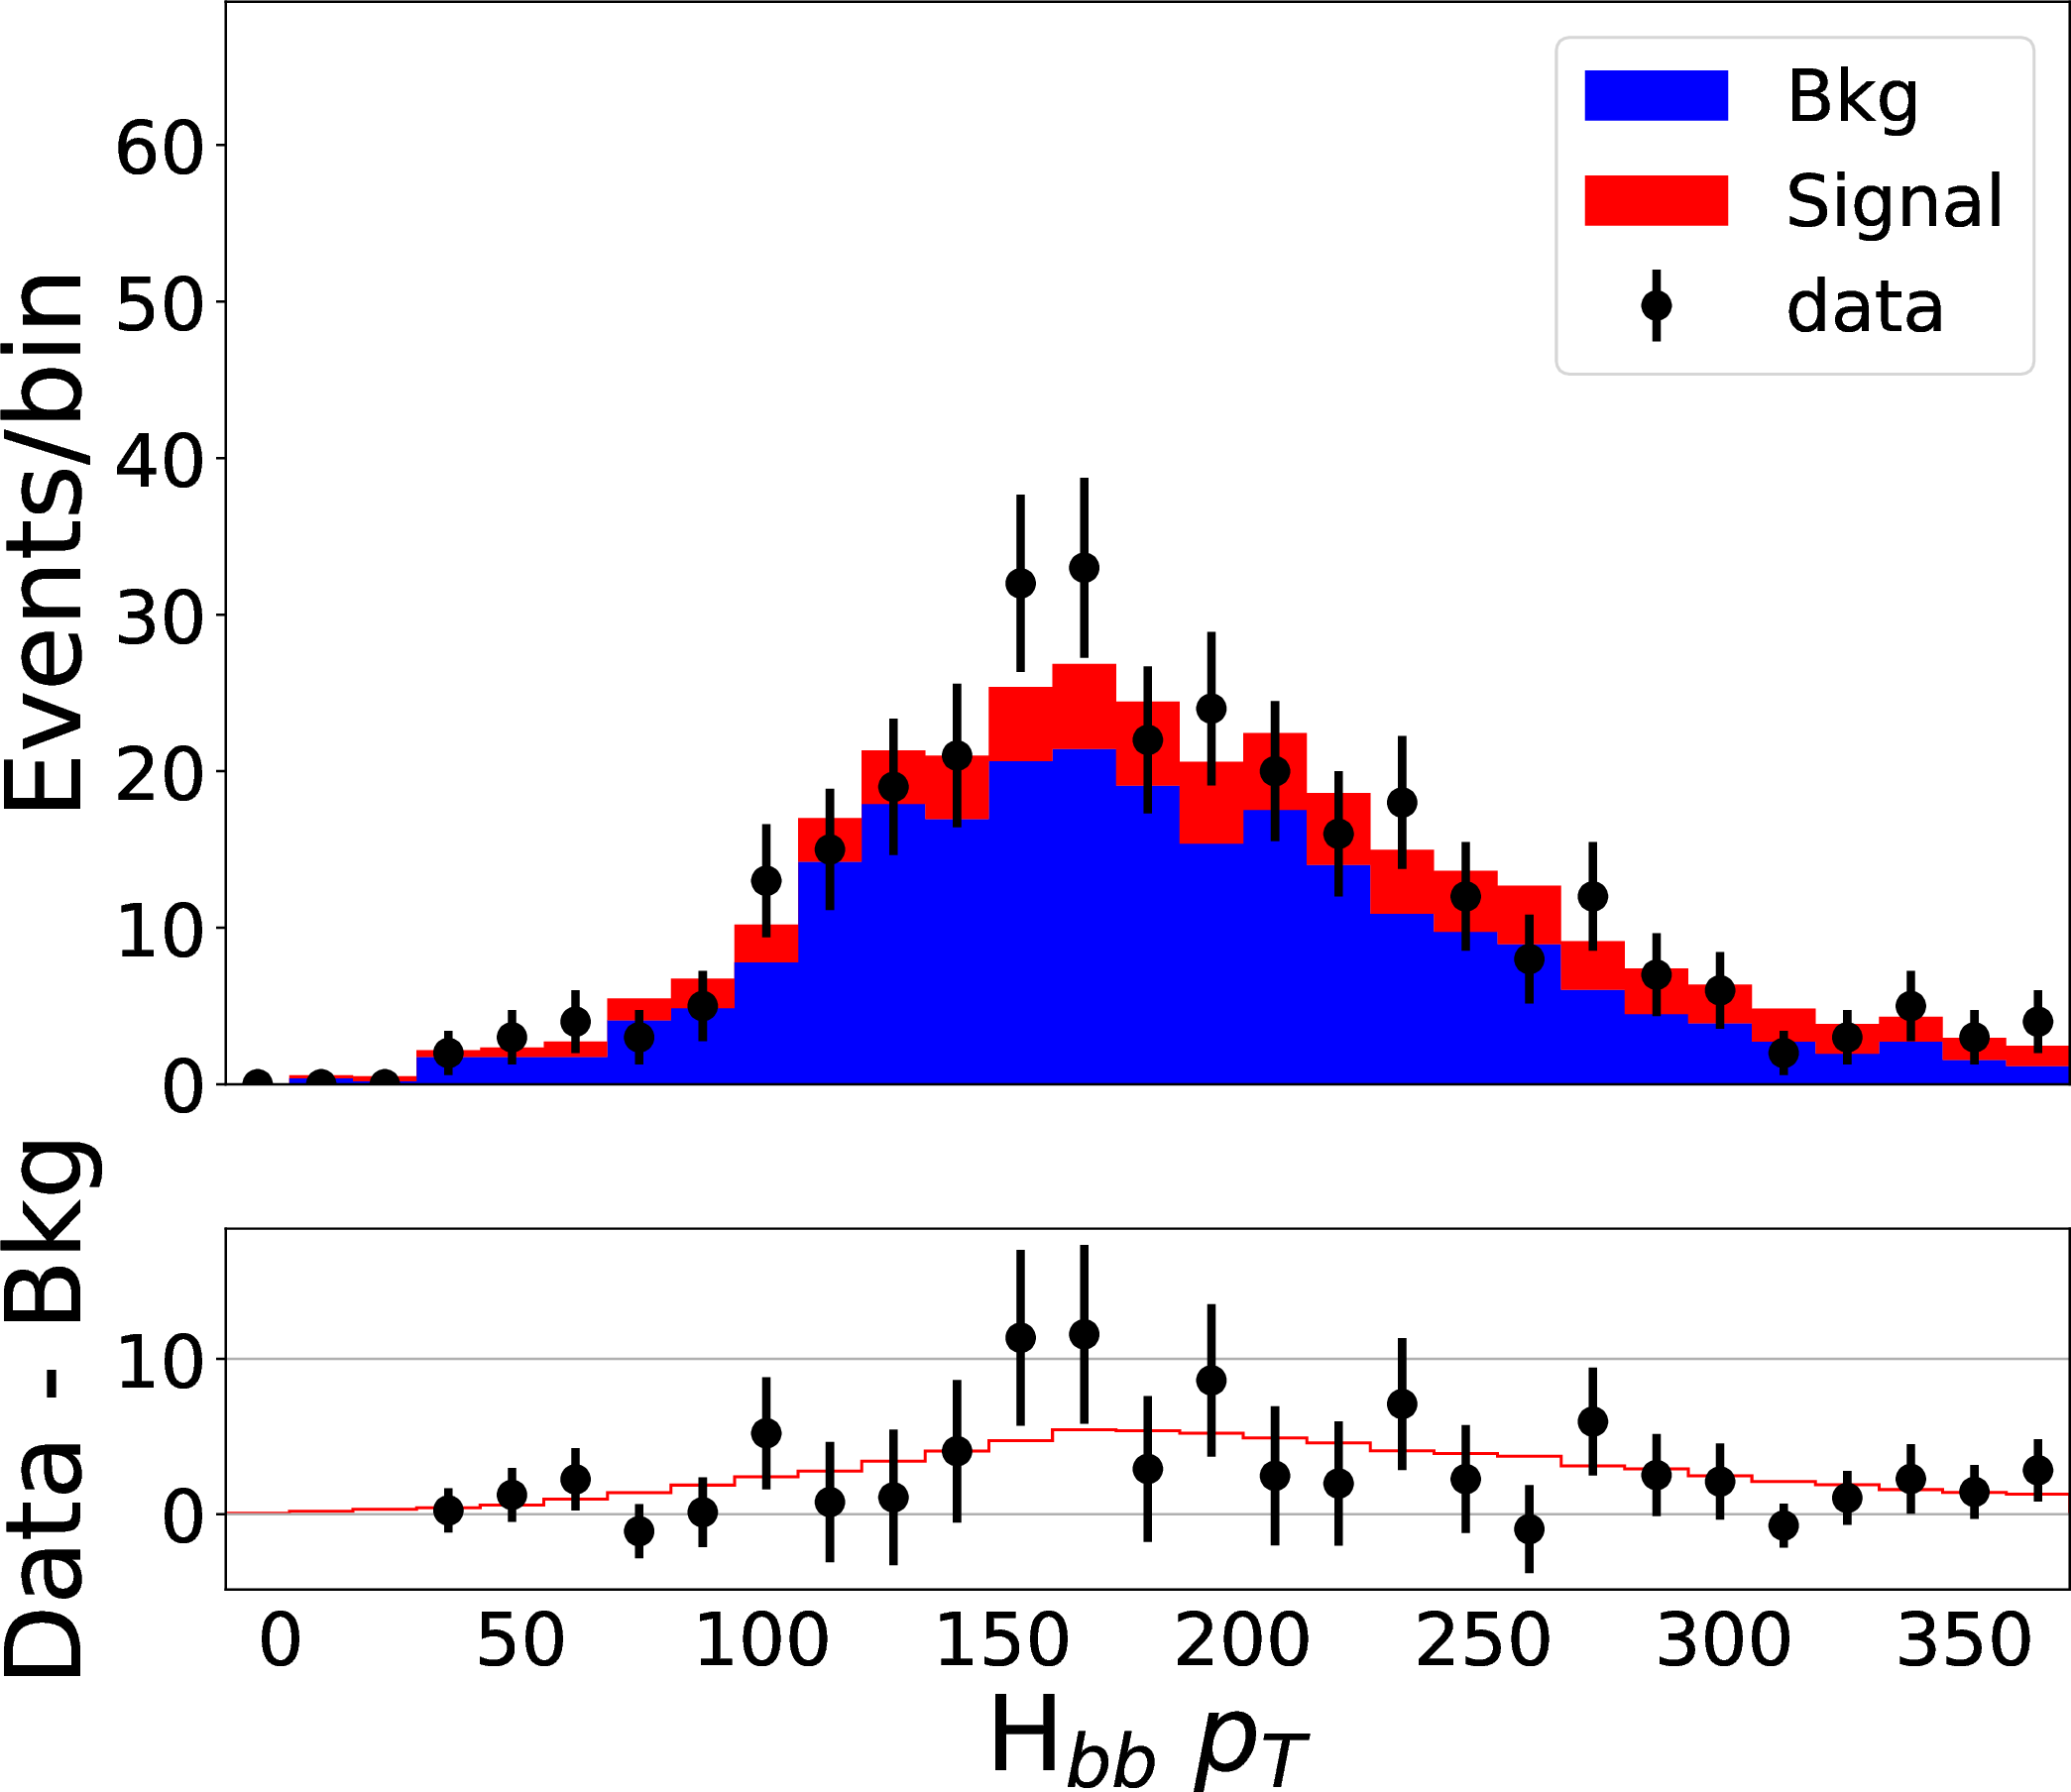
One of the nicest properties of HI-SIGMA is that, unlike a classifier score fit, the result is fully interpretable. Because we have a genuine model of the signal and background in the real, physical features, we can draw the fit in any of those features and literally see the signal sitting on top of the background, just like a traditional analysis. This makes it easy to spot mismodeling — something that is nearly impossible to do with a black-box classifier score. We can even zoom into the most signal-sensitive corners of the space, where the signal really stands out, and confirm the model still describes the data there.
Does it work?
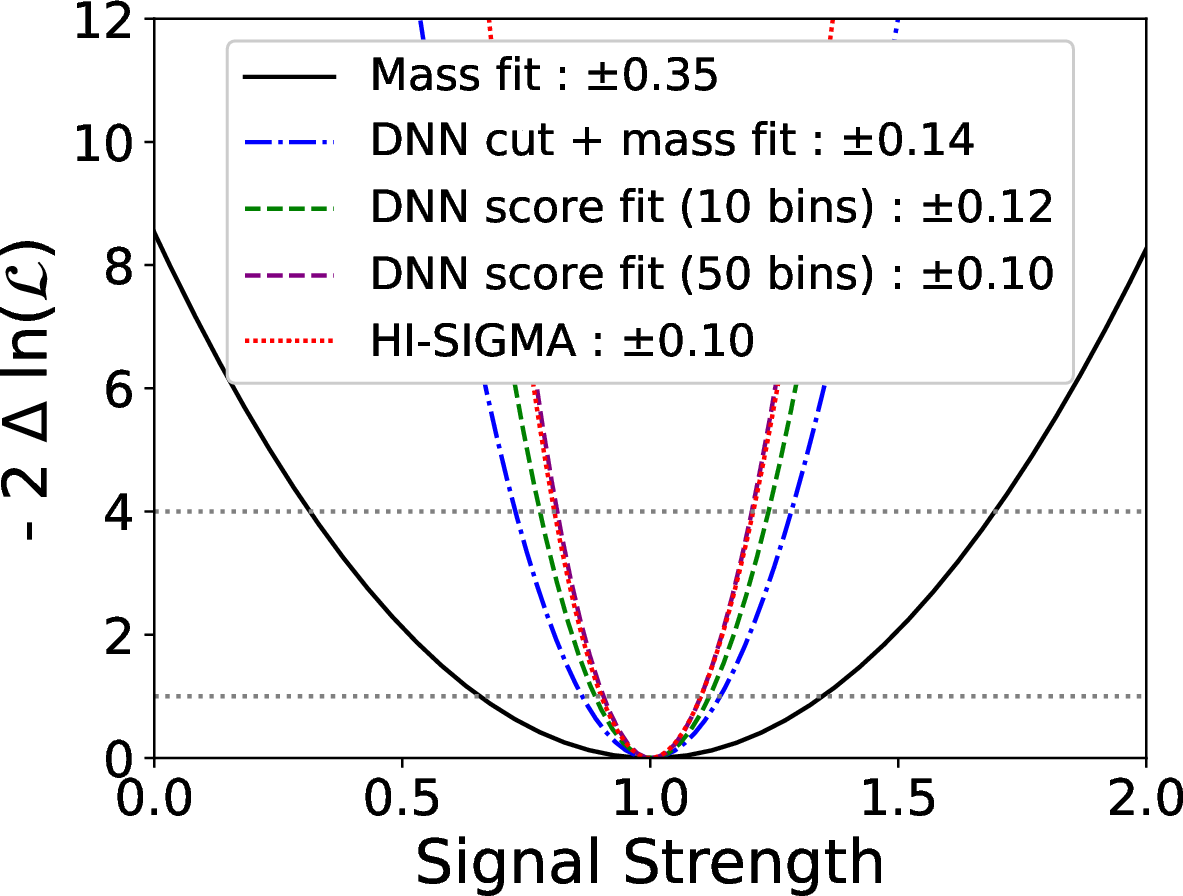
Yes. On our di-Higgs example, HI-SIGMA improved the precision on the signal by about 40% compared to the common “cut and fit” strategy, and it matched the performance of an idealized classifier score fit — all while providing a realistic, data-driven background estimate that the classifier approach lacks.
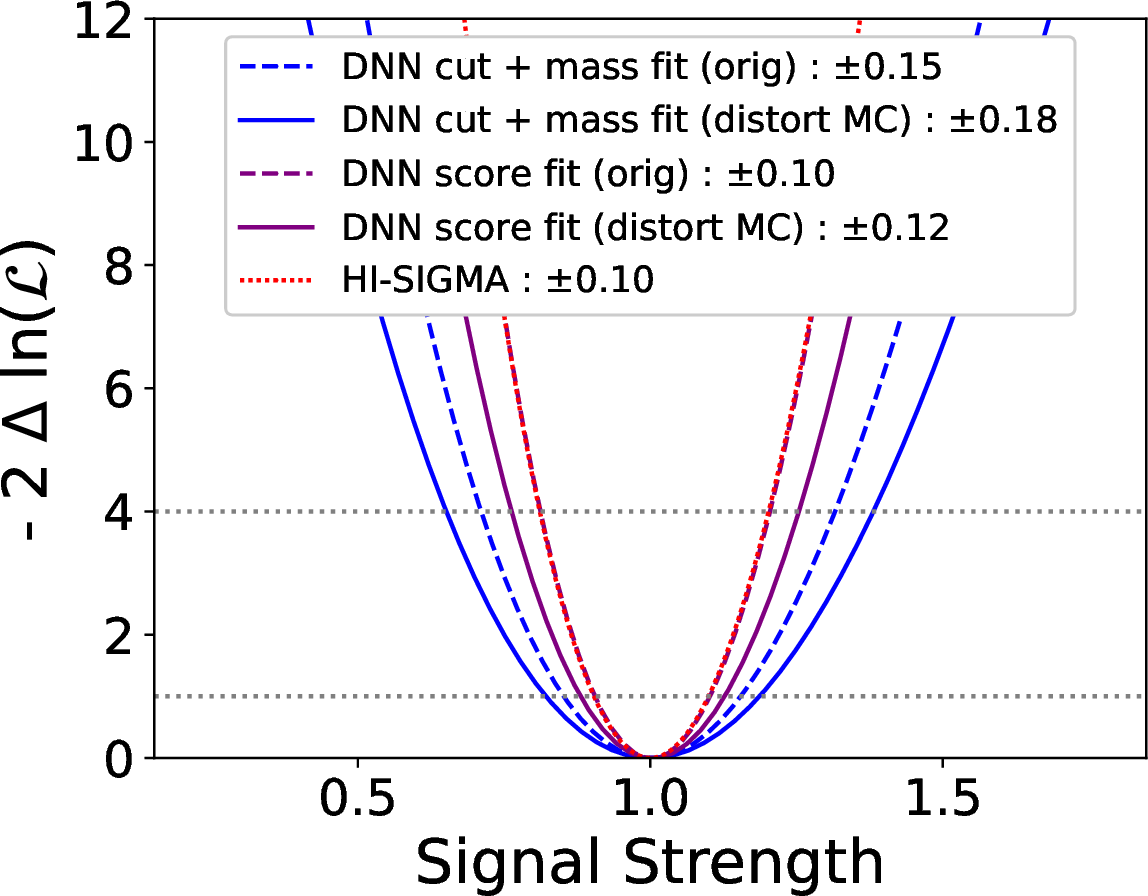
The most compelling result, though, is what happens when the simulation is wrong. To mimic realistic imperfections, we deliberately distorted the simulation used to train the classifiers and then asked each method to measure the (undistorted) data. The classifier-based methods lost about 20% of their sensitivity, because they had learned from a flawed picture of the background. HI-SIGMA, which never touches simulation for its background, was completely unaffected.
Why I’m excited about it
HI-SIGMA sits in the same family as simulation-based inference (SBI), a set of techniques for optimal multi-dimensional inference that the LHC community is increasingly excited about. But nearly all SBI proposals rely on simulation for their backgrounds, which rules them out for the many important analyses that require data-driven background estimates. HI-SIGMA fills exactly that gap.
A big part of this project was working out how to do the statistics rigorously. It’s one thing to get a machine learning model to estimate a density; it’s another to fold in all the systematic uncertainties — from the finite amount of training data to imperfections in the model — so that the final result has proper statistical coverage and can be trusted. We showed how the uncertainty-quantification techniques the field already uses for histogram-based fits can be extended to these ML density estimators, for example by training an ensemble of models on bootstrapped datasets and taking an envelope over their results.
Many of the flagship measurements of the coming years — di-Higgs production chief among them — feature narrow resonances and demand data-driven backgrounds which should be amenable to HI-SIGMA. Additionally, many of these measurements (like di-Higgs) have quantum interference effects and/or multiple parameters one wants to constrain (such as Effective Field Theory operators), so the gains from high-dimensional inference techniques compared to simple classifiers should be even larger. This is something we didn’t fully explore in our paper but would be interested to follow up. There’s plenty of follow-up work to do: pushing the method to higher-dimensional feature spaces, exploring diffusion models as the density estimator, and coming up with the proper uncertainty and validation methods on this new kind of analysis.
You can read all the details in the paper (Amram & Szewc, 2025). The code and datasets are also public on GitHub and Zenodo.